So far in this series of blogs we have used image processing techniques to improve the images, and then ensembled together the results of that image processing using GBM or XGBoost. But I have noticed that some competitors have achieved reasonable results using purely machine learning approaches. While these pure machine learning approaches aren’t enough for the competitors to get to the top of the leader board, they have outperformed some of the models that I have presented in this series of blogs. However these scripts were invariably written in Python and I thought that it would be great to see how to use R to build a similar type of model (except better, because we will include all of the image processing predictors that we have developed so far). So today we will add a brute-force machine learning approach to our model.
At the time of writing this blog, the ranked top competitor who has shared their script is placed 17th with an RMSE of 2.6%. While I am not very experienced in Python, I can usually figure out what a Python script is doing if I read it. So here’s what I think that script ise doing:
- pad out each image by an extra 2 pixels (see my last blog for how to pad out an image in R)
- run a 3×3 sliding window along the image pixels (see my last blog for how to create a sliding window in R)
- use all 9 pixels within the sliding window as predictors for the pixel in the centre of the sliding window
- use a random forest model to predict the pixel brightnesses
This is a pure machine learning approach because it doesn’t do any image processing to pre-process the image. It simply says that if you want to predict a particular pixel brightness, then you should probably look around at the brightnesses of the pixels either side of that pixel.
While I don’t want to fuel the R versus Python language wars, I do want to create a model in R that can outperform my competitors. So instead of using a 3×3 sliding window, I will use a 5×5 sliding window. Because the random forest implementation in R tends to run out of RAM on my computer, I will use XGBoost.
Here is how I create a 5×5 sliding window.
# show the predicted result for a sample image
img = readPNG("C:\\Users\\Colin\\dropbox\\Kaggle\\Denoising Dirty Documents\\data\\train\\3.png")

# create a padded image within which we will embed our source image
pad = 2
width = 2 * pad + 1
padded = matrix(1, nrow(img) + 2 * pad, ncol(img) + 2 * pad)
padded[pad + seq_len(nrow(img)), pad + seq_len(ncol(img))] = img

# create a matrix of predictor values - each column is a pixel from the sliding window
tab = NULL
for (i in seq_len(width))
{
for (j in seq_len(width))
{
if (i == 1 && j == 1)
{
tab = img2vec(padded[i - 1 + seq_len(nrow(img)), j - 1 + seq_len(ncol(img))])
} else {
tab = cbind(tab, img2vec(padded[i - 1 + seq_len(nrow(img)), j - 1 + seq_len(ncol(img))]))
}
}
}

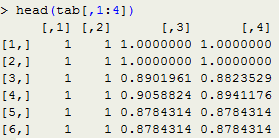
head(tab[,1:4])
When I noticed that this script ran a bit slowly, I looked at how I wrote the loops. R does not like manual looping, and it is very inefficient at appending data. So I rewrote the script to pre-allocate space for all of the cells rather than appending each column as it was calculated.
pad = 2
width = 2 * pad + 1
padded = matrix(1, nrow(img) + 2 * pad, ncol(img) + 2 * pad)
padded[pad + seq_len(nrow(img)), pad + seq_len(ncol(img))] = img

tab = matrix(1, nrow(img) * ncol(img), width ^ 2)
k = 1
for (i in seq_len(width))
{
for (j in seq_len(width))
{
tab[,k] = img2vec(padded[i - 1 + seq_len(nrow(img)), j - 1 + seq_len(ncol(img))])
k = k + 1
}
}
This modification gave me a tenfold improvement in speed! It’s a reminder that I shouldn’t be lazy when writing R scripts.
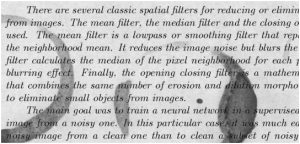
There’s one small issue to consider before we put this all together for a new more powerful predictive model. In the code above I have used a brightness value of 1 when padding out the image, but that doesn’t look natural. The image below shows a clear white border around the image. This could confuse the machine learning algorithm, as it could waste time learning what to do with pure white pixels.
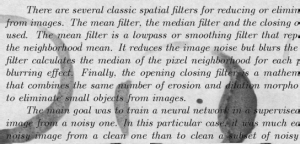
So instead it makes sense to pad out the image with a background brightness. One way to do this is to replicate the edge of the original image.
pad = 2
width = 2 * pad + 1
padded = matrix(1, nrow(img) + 2 * pad, ncol(img) + 2 * pad)
padded[pad + seq_len(nrow(img)), pad + seq_len(ncol(img))] = img
# fill in the padded edges
padded[,1:pad] = padded[,pad + 1]
padded[,ncol(img) + pad + 1:pad] = padded[,ncol(padded) - pad]
padded[1:pad,] = padded[pad + 1,]
padded[nrow(img) + pad + 1:pad,] = padded[nrow(padded) - pad,]
This looks more natural, except where there is writing at the edge of the image. Another way is to pad out the pixels using the median of the entire image.
pad = 2
width = 2 * pad + 1
padded = matrix(median(img), nrow(img) + 2 * pad, ncol(img) + 2 * pad)
padded[pad + seq_len(nrow(img)), pad + seq_len(ncol(img))] = img
I haven’t tested which approach works best. So I leave it to the reader to compare the results from the three different padding approaches, and use whichever gives the best result (although I suspect that there won’t be much difference between the second and third approaches).
Let’s pull it all together, and add the surrounding pixels as a predictor to a more complete model.
# libraries
if (!require("pacman")) install.packages("pacman")
pacman::p_load(png, raster, data.table, gbm, foreach, doSNOW, biOps, xgboost, Ckmeans.1d.dp)

if (!require("EBImage"))
{
source("http://bioconductor.org/biocLite.R")
biocLite("EBImage")
}

# a function to do k-means thresholding
kmeansThreshold = function(img)
{
# fit 3 clusters
v = img2vec(img)
km.mod = kmeans(v, 3)
# allow for the random ordering of the clusters
oc = order(km.mod$centers)
# the higher threshold is the halfway point between the top of the middle cluster and the bottom of the highest cluster
hiThresh = 0.5 * (max(v[km.mod$cluster == oc[2]]) + min(v[km.mod$cluster == oc[3]]))

# using upper threshold
imgHi = v
imgHi[imgHi <= hiThresh] = 0 imgHi[imgHi > hiThresh] = 1

return (imgHi)
}

# a function that applies adaptive thresholding
adaptiveThresholding = function(img)
{
img.eb  0] = 0
m1 = min(foreground)
m2 = max(foreground)
foreground = (foreground - m1) / (m2 - m1)

return (matrix(foreground, nrow(img), ncol(img)))
}

# a function that groups together the pixels contained within a sliding window around each pixel of interest
proximalPixels = function(img)
{
pad = 2
width = 2 * pad + 1
padded = matrix(median(img), nrow(img) + 2 * pad, ncol(img) + 2 * pad)
padded[pad + seq_len(nrow(img)), pad + seq_len(ncol(img))] = img

tab = matrix(1, nrow(img) * ncol(img), width ^ 2)
k = 1
for (i in seq_len(width))
{
for (j in seq_len(width))
{
tab[,k] = img2vec(padded[i - 1 + seq_len(nrow(img)), j - 1 + seq_len(ncol(img))])
k = k + 1
}
}

return (tab)
}

dirtyFolder = "C:\\Users\\Colin\\dropbox\\Kaggle\\Denoising Dirty Documents\\data\\train"
cleanFolder = "C:\\Users\\Colin\\dropbox\\Kaggle\\Denoising Dirty Documents\\data\\train_cleaned"
outFolder = "C:\\Users\\Colin\\dropbox\\Kaggle\\Denoising Dirty Documents\\data\\train_predicted"

outPath = file.path(outFolder, "trainingdata_blog6.csv")
filenames = list.files(dirtyFolder)
for (f in filenames)
{
print(f)
imgX = readPNG(file.path(dirtyFolder, f))
imgY = readPNG(file.path(cleanFolder, f))

# turn the images into vectors
x = matrix(imgX, nrow(imgX) * ncol(imgX), 1)
y = matrix(imgY, nrow(imgY) * ncol(imgY), 1)

# threshold the image
x2 = kmeansThreshold(imgX)

# adaptive thresholding
x3 = img2vec(adaptiveThresholding(imgX))

# canny edge detector and related features
x4 = img2vec(cannyEdges(imgX))
x5 = img2vec(cannyDilated1(imgX))
x6 = img2vec(cannyDilated2(imgX))

# median filter and related features
x7 = img2vec(median_Filter(imgX, 17))
x8 = img2vec(background_Removal(imgX))

# surrounding pixels
x9 = proximalPixels(imgX)

dat = data.table(cbind(y, x, x2, x3, x4, x5, x6, x7, x8, x9))
setnames(dat,append(c("y", "raw", "thresholded", "adaptive", "canny", "cannyDilated1", "cannyDilated2", "median17", "backgroundRemoval"), paste("x", 1:25, sep="")))
write.table(dat, file=outPath, append=(f != filenames[1]), sep=",", row.names=FALSE, col.names=(f == filenames[1]), quote=FALSE)
}

# read in the full data table
dat = read.csv(outPath)

# fit an xgboost model to a subset of the data
set.seed(1)
rows = sample(nrow(dat), 2000000)
dat[is.na(dat)] = 0
dtrain  1] = 1
imgOut = matrix(yHatImg, nrow(img), ncol(img))
writePNG(imgOut, "C:\\Users\\Colin\\dropbox\\Kaggle\\Denoising Dirty Documents\\data\\sample.png")
plot(raster(imgOut))
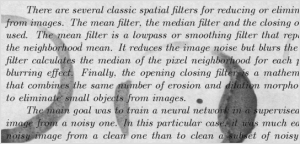
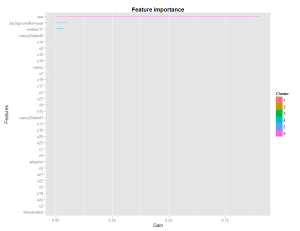
None of the individual pixels that we added have strong predictive powers, yet our RMSE on the training data dropped from 2.4% for the last blog’s model to 1.4% for this model! That’s because it is the combination of nearby pixels that are predictive, not just any individual pixel. I haven’t scored this model on the test set, but I suspect that it will get you a good ranking.
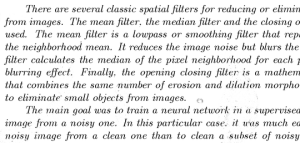
There is hardly any trace of the coffee cup stain remaining. This is a pretty good candidate model.
In order to understand the effect of the nearby pixels, it is useful to visualise their variable importance in a grid.
pixelNames = paste("x", 1:25, sep="")
pixelNames[13] = "raw"
grid = t(matrix(sapply(1:25, FUN = function(x) importance_matrix$Gain[importance_matrix$Feature == pixelNames[x]]), 5, 5))
grid[3, 3] = NA
plot(raster(grid))
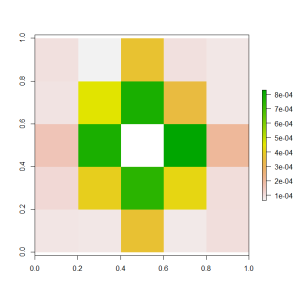
This graphic shows that we didn’t need all of the surrounding pixels to create a good predictive model. The pixels that don’t lie on the same row or column as the target pixel aren’t as important. If we wanted to expand beyond the 3×3 sliding window used by our competitors, then we didn’t need to add all of the extra pixels. We could have just added the pixels at (1, 3) and (3, 1) and (3, 5) and (5, 3).
The model that we developed in this blog is pushing the boundaries of what my PC can do. Without access to very powerful computers and / or a cluster, we need to use a different approach if we want to improve on this blog’s model.


Thank you Colin for your insights
I am a novice at data science having just completed the MITx Analytics edge course. One of my biggest realizations so far is exactly what you allude to here and that is that some of these models with relatively minor data tweaking produce very decent results
LikeLike
Hi Nick,
I’m glad you like my blog 🙂
I’ve been doing this type of thing for many years, but I am still overwhelmed by how much I am learning every day just by experimenting and looking at what others are doing.
Colin
LikeLike
Great stuff, Colin. I thought it was interesting how the importance chart didn’t show any one individual pixel as being significant. Is there another similar importance chart or metric that can show the importance of a combination of pixels?
I’m curious to see where we’ll go from here.
LikeLike
Hi Bobby,
You can’t do that directly, but you could can a model with stacking i.e. have a model that is just for the proximal pixels, and then use that model as a predictor in your main model instead of using all of the proximal pixels. That’s what I was planning on writing about for my next blog or maybe the one after that.
Colin
LikeLike
I’m trying the same idea just with the use of neural networks. There is a good paper on that techique http://www.researchgate.net/publication/221258673_Enhancement_and_Cleaning_of_Handwritten_Data_by_Using_Neural_Networks.
LikeLike
Hi Codingluke,
I also have a model that uses neural networks and will probably write about it some time over the next month.
Colin
LikeLike
Pingback: Denoising Dirty Documents: Part 7 | Keeping Up With The Latest Techniques